Using CartoDB to visualize how far birds migrate in a single night
We created two nocturnal bird migration forward trajectory visualizations for ENRAM.
We no longer have a CartoDB/CARTO account and have replaced embedded maps with screenshots.
Last week we participated in a very productive workshop in Amsterdam organized by working group 3 of ENRAM. ENRAM is the European Network for the Radar Surveillance of Animal Movement funded by COST and the workshop was a follow-up on the hackathon where we created the flow visualization last year.
One of our goals this year was to visualize forward trajectory model data for bird migration. We were inspired by the fabulous Alcatraz escape simulation made by Dutch researchers in CartoDB to try this ourselves.
Long-range surveillance radar
The source data for our visualizations were gathered and processed by a bird radar detection system called ROBIN. The ROBIN system received a radar signal from two long-range surveillance radars in Belgium and the Netherlands. Every half hour radar measurements were sampled from ten successive high-resolution images and processed to extract location, ground speed, and track direction of individual birds or flocks. For this project we used data from the first two hours after sunset on April 7, 2013. During this period birds take-off from the radar locations to continue their nocturnal spring migration.
Forward trajectory model
For each individual bird track we extracted time, location, ground speed, and track direction and calculated the airspeed and heading using the wind at 925hPa. We used these parameters to simulate a forward trajectory based on a model described in Shamoun-Baranes & van Gasteren 2011. By keeping the birds’ airspeed and heading constant, influences of wind will effect new positions each 5 minutes and result in the presented forward trajectory until sunrise. Strong following winds during the night or location can increase the ground speeds above 100 km per hour.
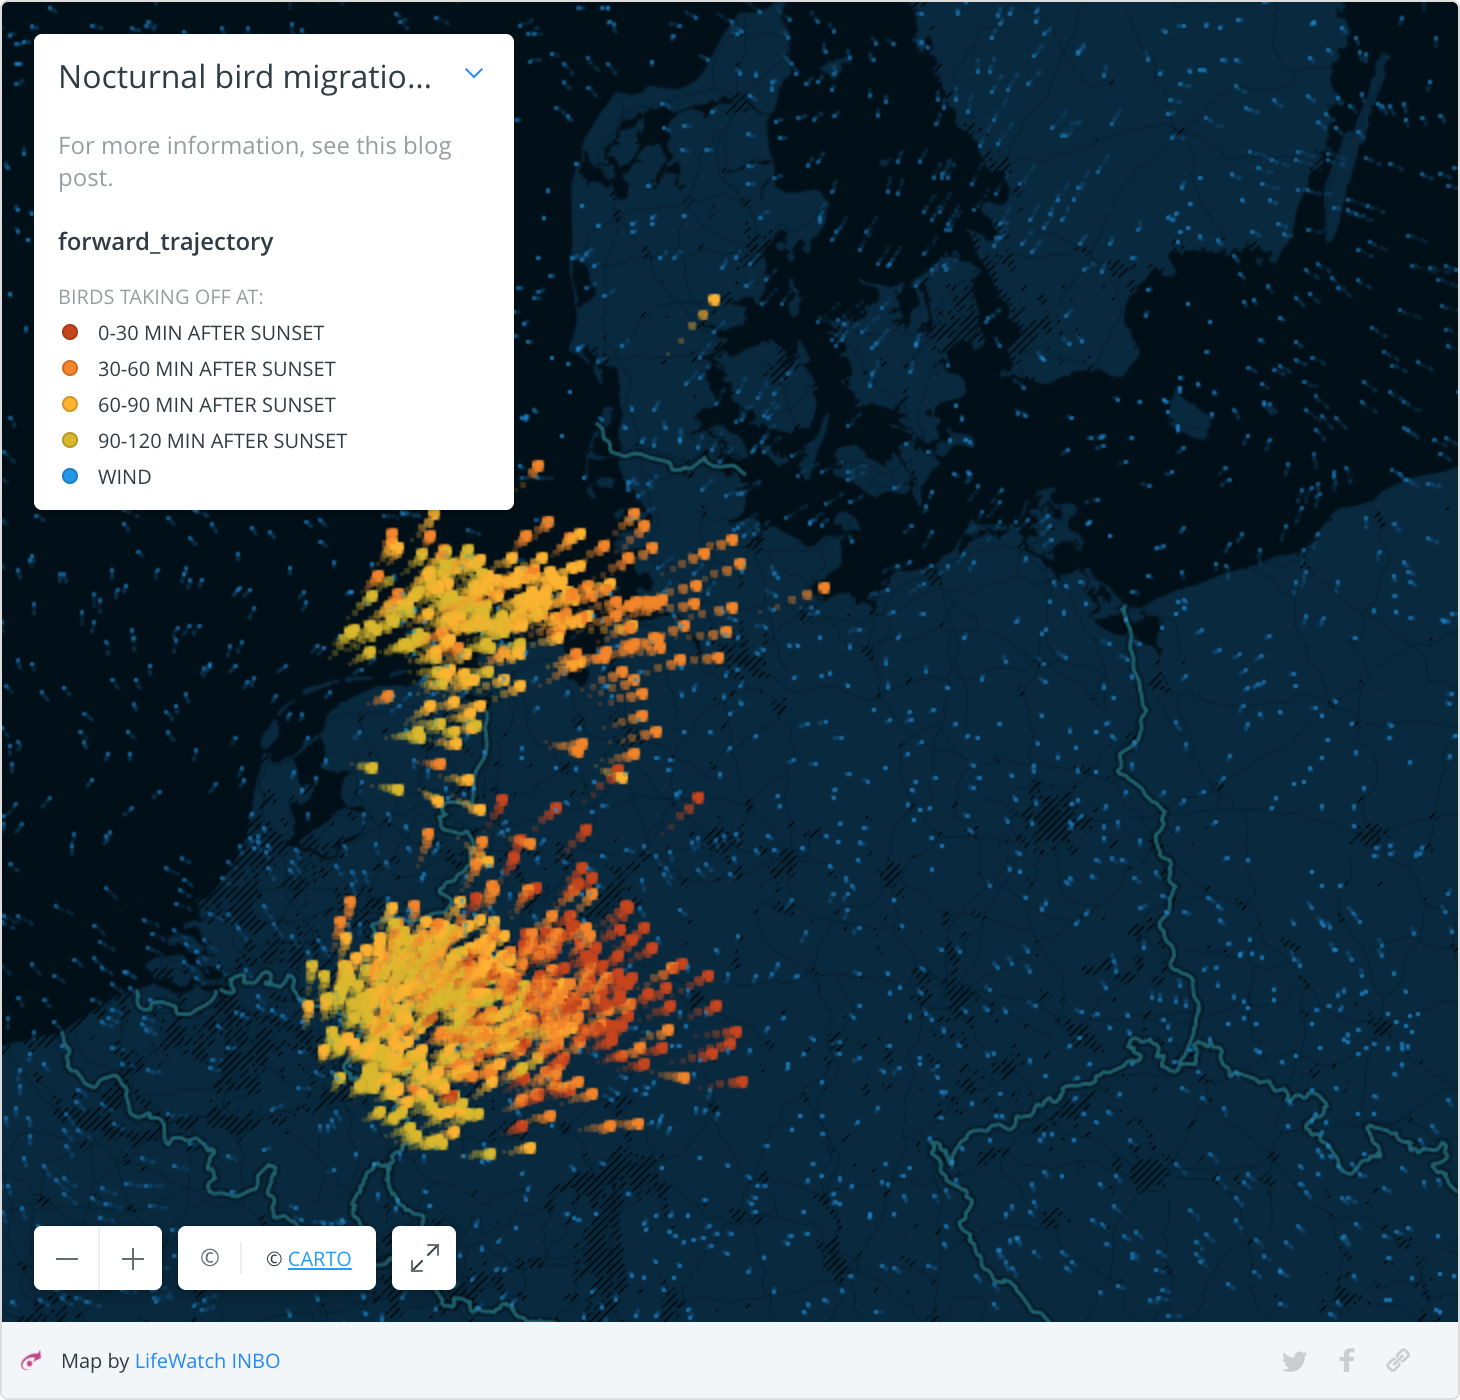
Half hour take-off groups
In this visualization we show nocturnal bird migration on the night of April 7-8, 2013. Bird tracks were measured every half hour and are shown as different groups in the visualization. The wind is shown as small blue tracks in the background. Note that some birds even reach the Baltic states in a single night, assuming they continued their flights until sunrise.
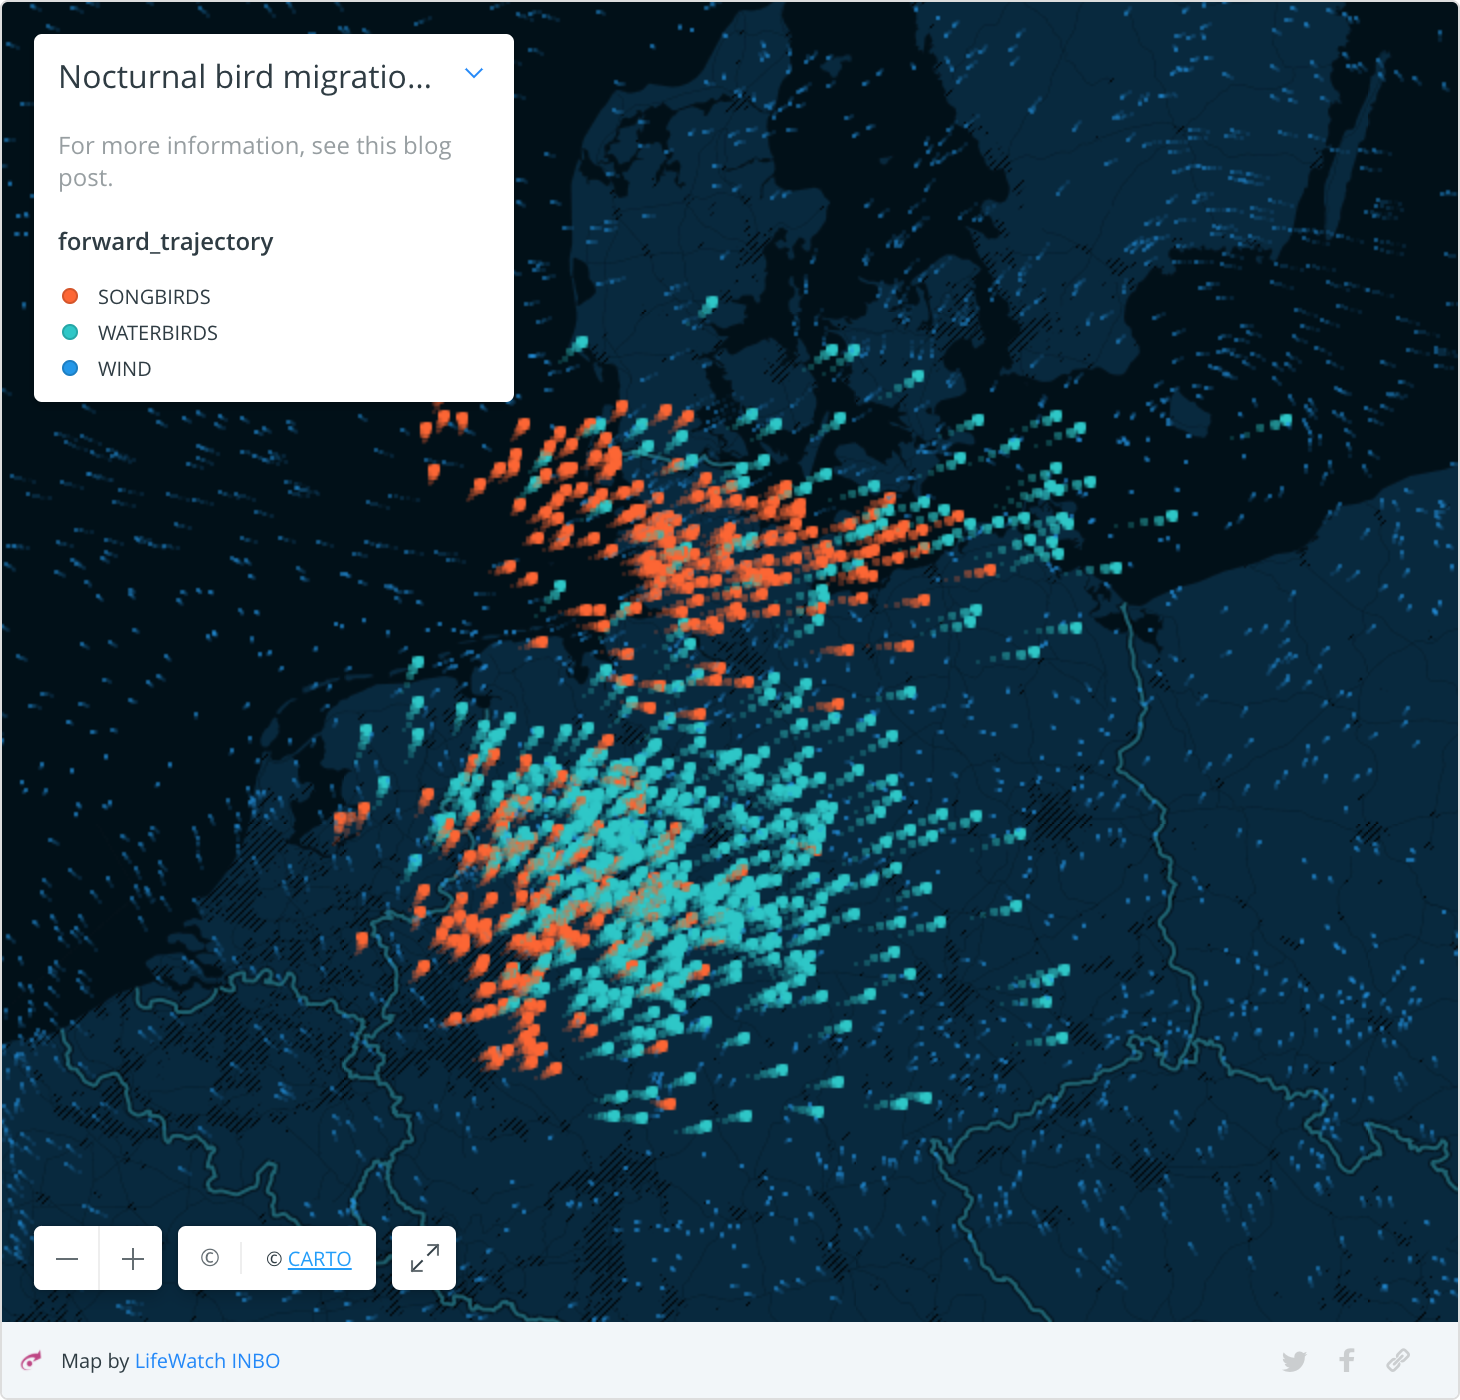
Songbirds and waterbirds based on airspeed
In this visualization we show the same night (April 7-8), but we define two classes of birds based on the birds’ airspeed:
- Songbirds, with an airspeed below 16m/s, shown in orange
- Waterbirds (geese, ducks, and waders) with an airspeed above 16m/s, shown in blue.
This visualisation shows that especially waterbirds (ducks and/or waders) dominated the bird migration (light blue colours) and due to their faster airspeeds could reach the Baltic states in a single night, a distance of 900km in 10 hours (i.e. 90km/h or 25m/s). This is much faster than what would be possible based on their powered flight alone, i.e. their airspeed, which was on average 21m/s on which they could potentially have flown 750km in a single night without wind. Birds mainly profited from the following winds in their last hours above Poland.
The SQL and CartoCSS for these visualizations are available in this gist.