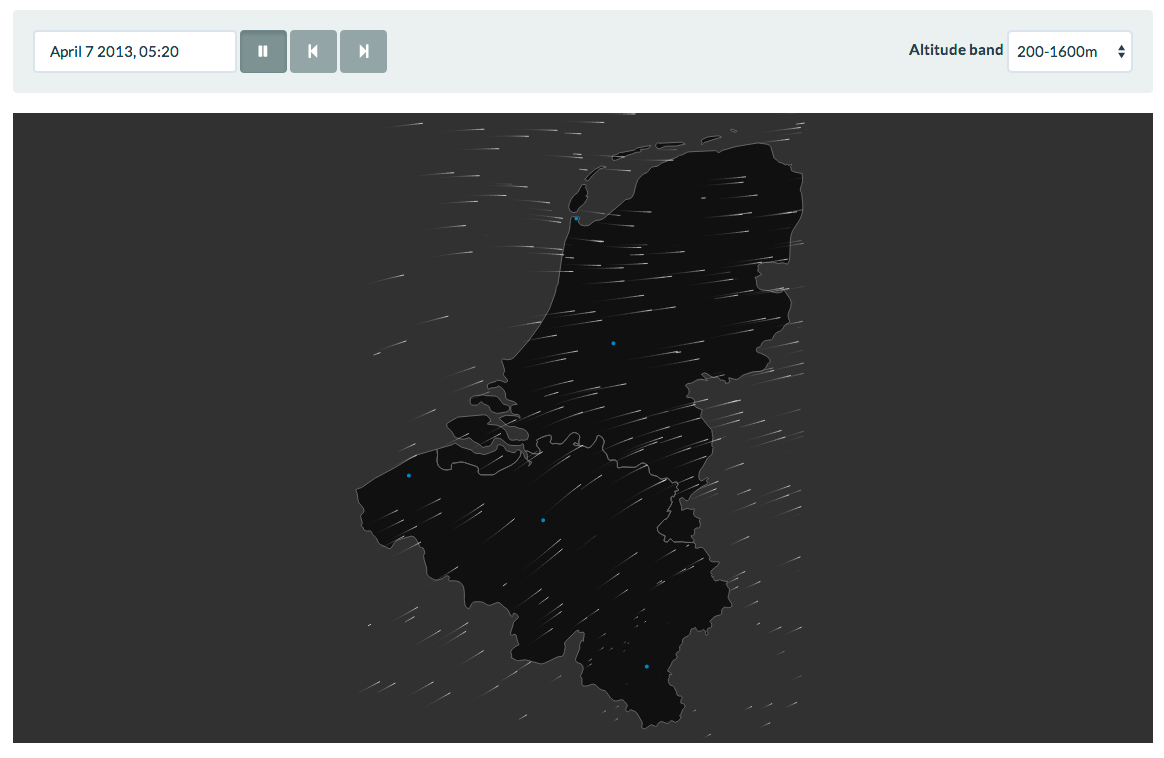
Visualizing one week of bird migration detected by weather radars
We created a bird migration flow visualization for ENRAM during a 5 day hackathon.
Weather radars can detect bird migration, but visualizing these data in an easy to understand manner is challenging. Inspired by air - an open source flow visualization of wind in Tokyo - we wondered if we could do the same for bird migration data.
So, last week our team created a bird migration flow visualization during a 5 day hackathon, hosted at the University of Amsterdam in collaboration with the KNMI. It was created for the European Network for the Radar Surveillance of Animal Movement (ENRAM) and funded by COST as a short term scientific mission. The long-term goal of ENRAM is to retrieve this kind of data at a European scale.
We are quite happy with the result and are looking forward to improve upon our proof of concept in the ENRAM data challenge (to be organized late 2014/early 2015).
